
How To Find P Value In Excel: Step by Step
The p-value or the probability value, is an important concept in statistical hypothesis testing.
Its use in hypothesis testing is common in certain fields like finance, physics, economics, psychology, and more. Once you learn how to find the p value in excel it becomes a great time-saver.
How To Find P Value In Excel:
The Formula & Arguments
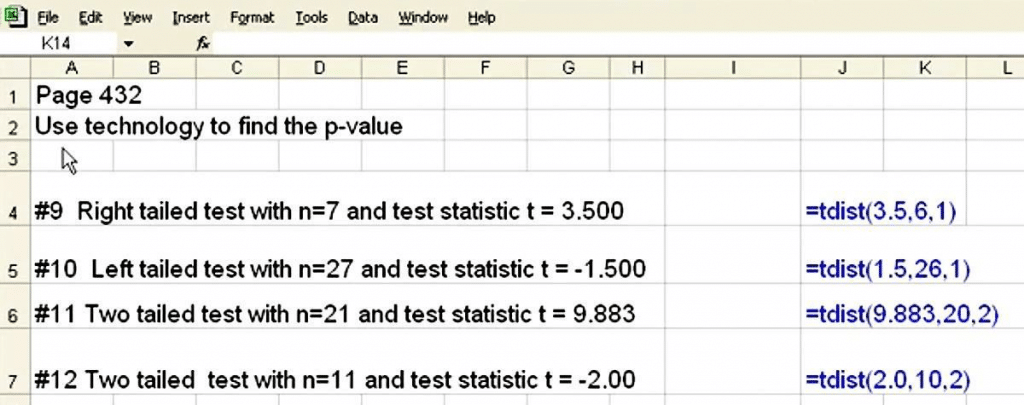
When you begin testing a hypothesis in statistics, the p-value can help determine support for or against a claim by quantifying the evidence. For that, the Excel formula that is going to be used to calculate the p-value is:
- =tdist(x,deg_freedom,tails)
Where the arguments are:
- x = t
- deg_freedom = n-1 (degrees of freedom)
- tails = 1 for a one-tail test or 2 for a two-tail test
Significance Level & Testing
The usual significance level used is 0.05, which says that if the resultant p-value is equal to or less than 0.05, then there’s strong evidence against the null hypothesis (and enter the alternative hypothesis). If the p-value is larger, then the null hypothesis has merit. And so to solve the p-value in an Excel spreadsheet, simply select a cell and type in =t-dist( to bring up the formula and then type in the arguments, separating each by a comma:
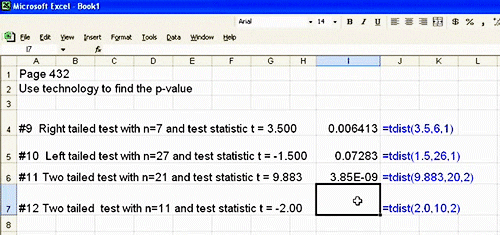
Let’s say we use 0.05 as the significance level, then from this set, what can we expect? Considering the calculated p-values in column I in our examples above, we can conclude that all tests but the first (p-value = 0.006413) have strong evidence in favor of the null hypothesis.
Now, are you ready to carry out some hypothesis testing of your own? Then, get started to open up Excel, check out the original tutorial below by the YouTube channel: meaniefiene and go crazy finding the p- value. Fair warning, although the tutorial uses an older version of Excel, the function works the exact same way on newer versions, so it doesn’t really matter if you’re using Excel on a Windows or Mac computer.